SQL
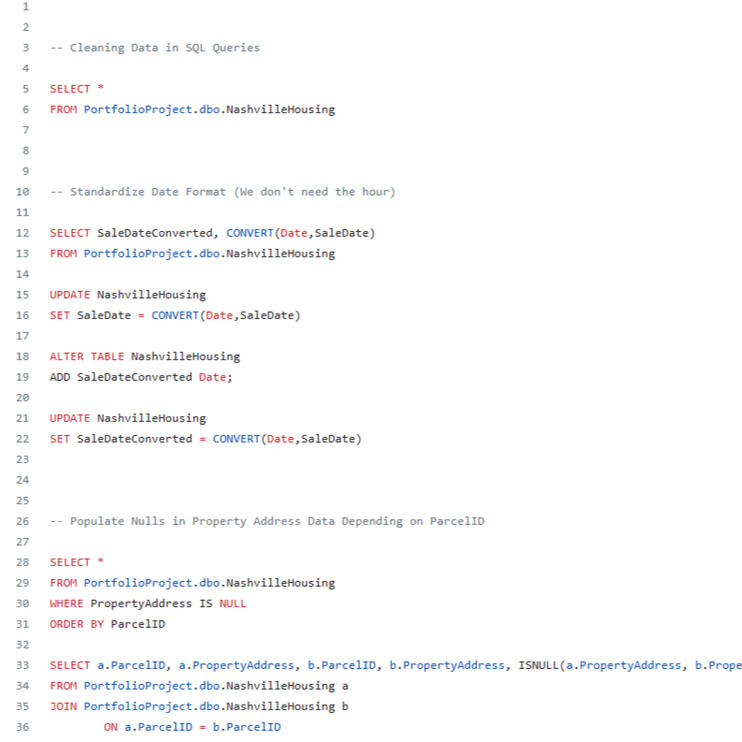
This is a Data Cleaning Project in SQL.The data source is an excel file containing 56477 rows of data.Steps followed:1. Standardized Date format to get rid of the hour which was not needed.2. Populated Nulls in Property Address Data depending on ParcelID.3. Split Property Address into individual columns (Address, City) using SUBSTRING.4. Split Owner Address into individual columns (Address, City, State) using PARSENAME.5. Changed Y and N to Yes and No in "Sold as Vacant" column.6. Removed duplicates.7. Deleted unused columns.To see my full code on GitHub, please click below:
Tableau
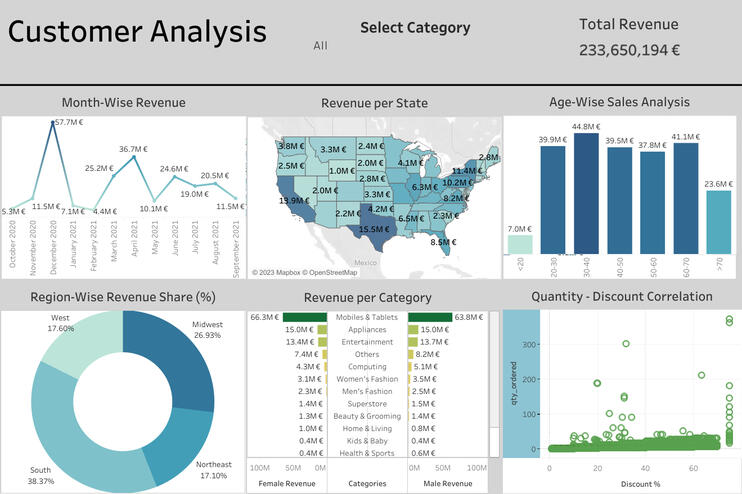
This is a Customer Analysis dashboard visualized in Tableau.
The data source is a CSV file containing 286392 rows of data.I created various visuals such as a map, line, bar, donut charts etc to help me create a dashboard.I applied filters to all my visuals to help my stakeholders navigate and select various elements to get insights:1. A positive correlation was found between discount and quantity ordered.2. Revenue peak was on December 2020.3. Mobiles and Tablets gave the company the highest sales.For the interactive dashboard, please click below:
Power BI
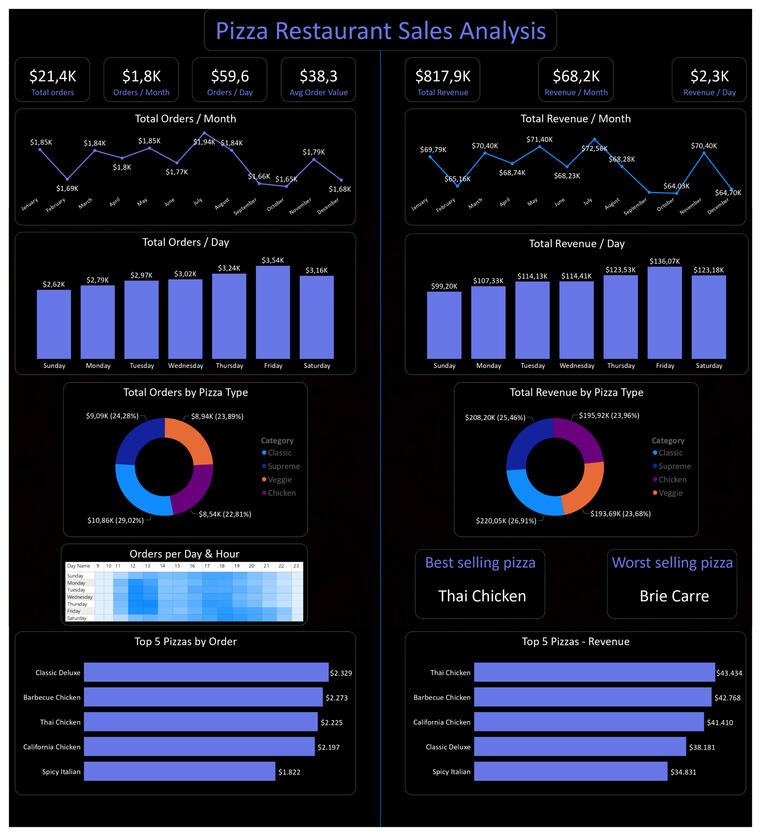
This is a Sales Analysis dashboard visualized in Power BI.The dataset I was given concisted of 4 CSV files.The goal was to help a pizza restaurant owner improve their business efficiency and increase revenue.I connected to all 4 CSV files and transformed them and created a relational data model with relationships among tables using primary and foreign keys.For the full project on Maven Analytics, please click below:
Python
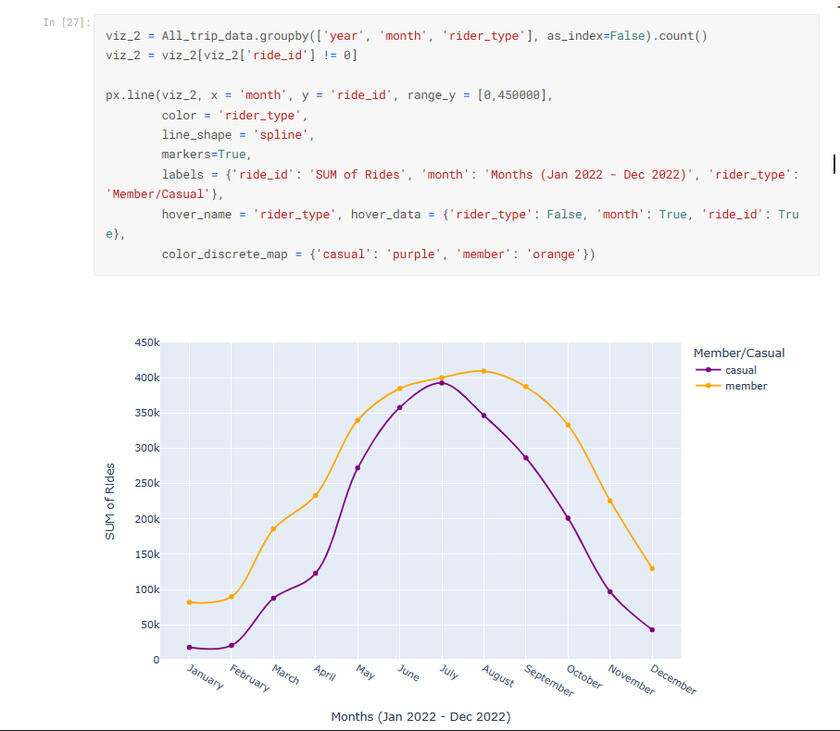
This case study is the Capstone Project of Google Data Analytics Professional Certificate, which I completed in Python.Scenario: As a Data Analyst working in the marketing analyst team at Cyclistic, a bike-share company in Chicago, I was asked by the director of marketing and my manager to understand how casual riders and annual members use Cyclistic bikes differently, so as to convert casual riders into annual members.I completed my analysis following the 6 Steps of Data Analysis: Ask, Prepare, Process, Analyze, Share and Act.For the full project on Kaggle, please click below:
Excel
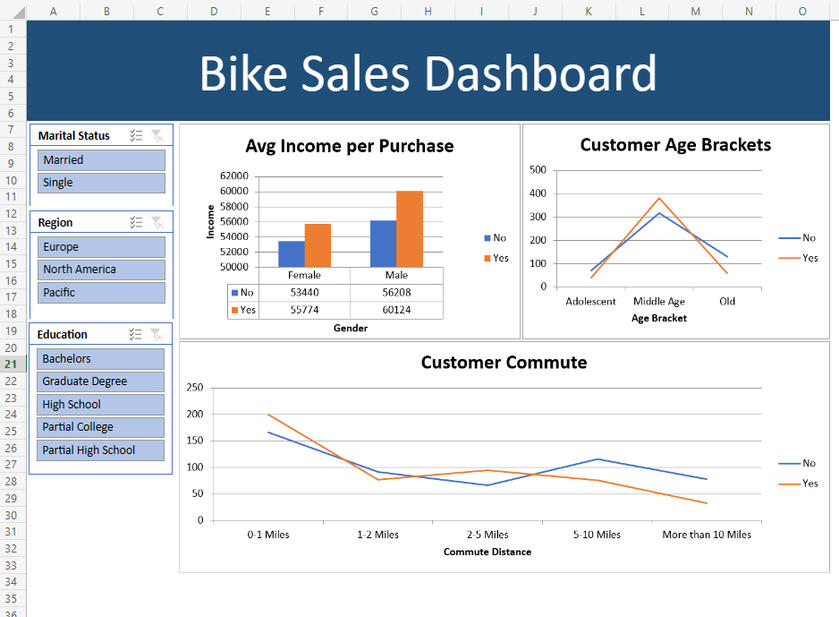
This is an excel dashboard project for Data Analysis.The data source is an excel file containing 1026 rows of data.
Steps followed:1. Removed Duplicates.2. Replaced M and S on “Marital Status” column with “Married” and “Single”.3. Replaced M and F on “Gender” column with “Male” and “Female”.4. Created the “Age Brackets” column based on the “Age” column and added 3 age groups (Adolescent – Middle Age and Old) to help me with my visualization.5. Inserted 3 Pivot Tables and 3 Graphs.6. Created my Dashboard using those 3 Graphs.7. Inserted Slicers and applied them to all my graphs to help me get insights.For the full excel project, please click below:
